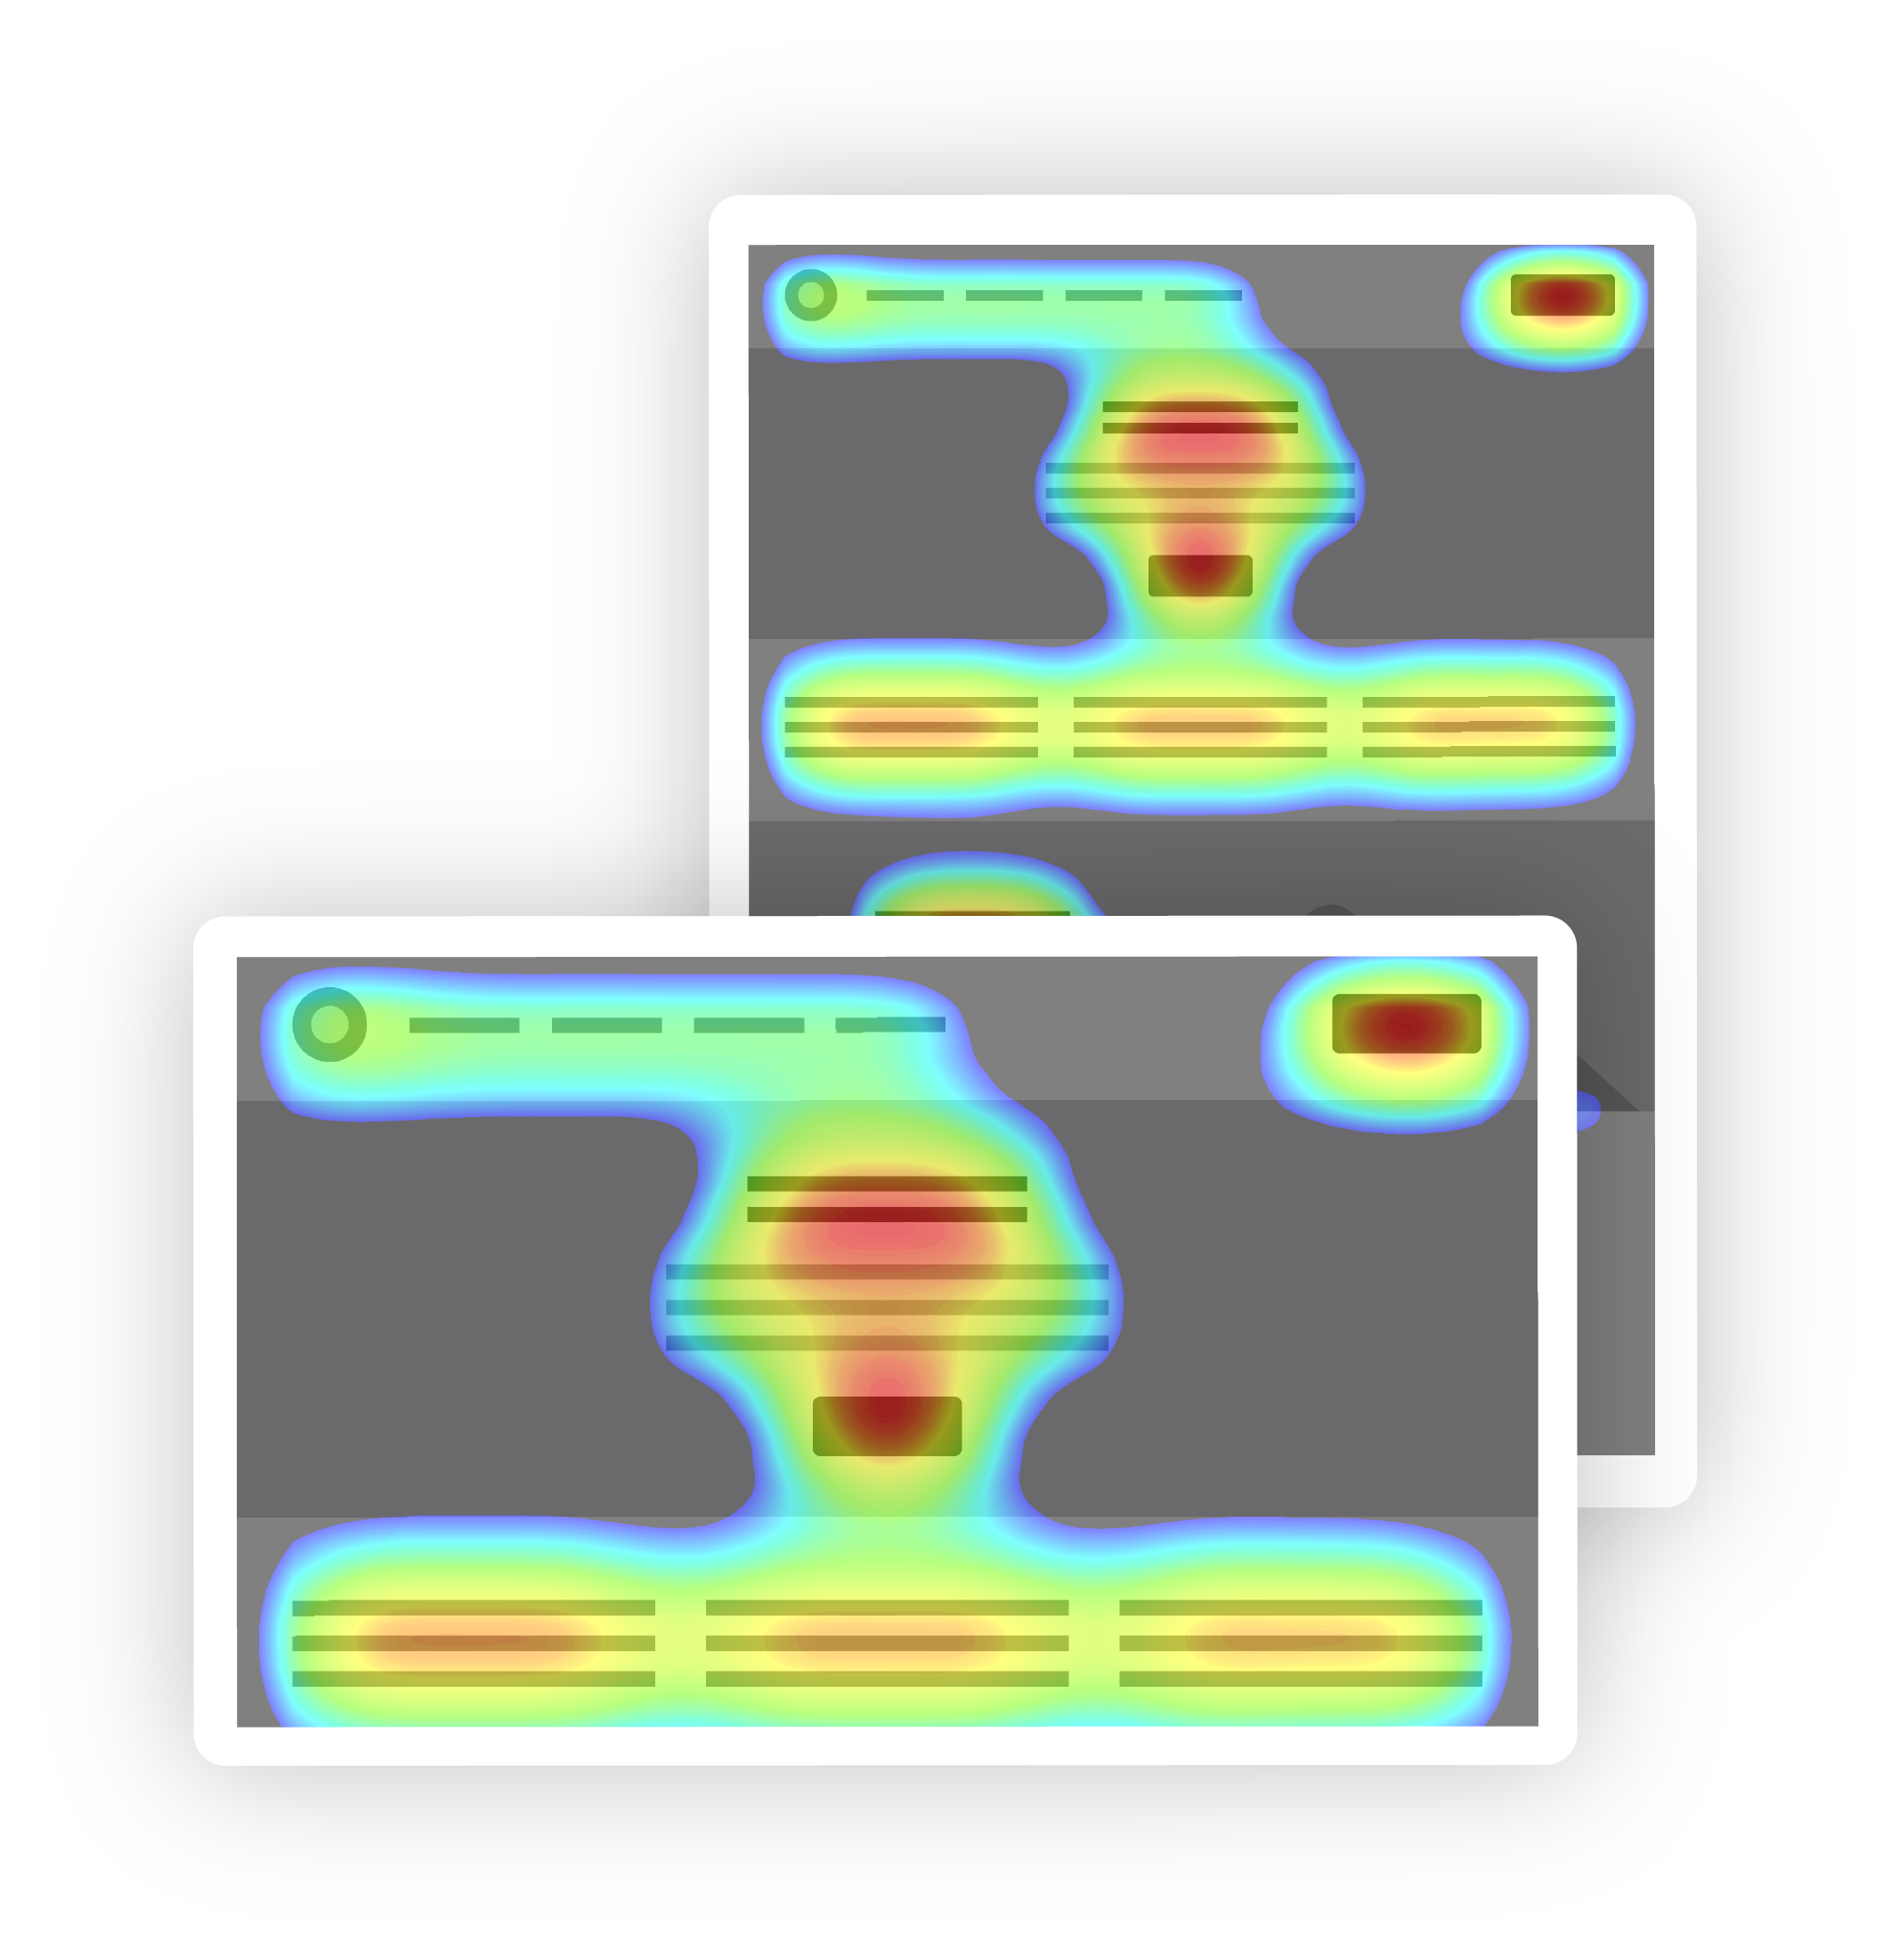
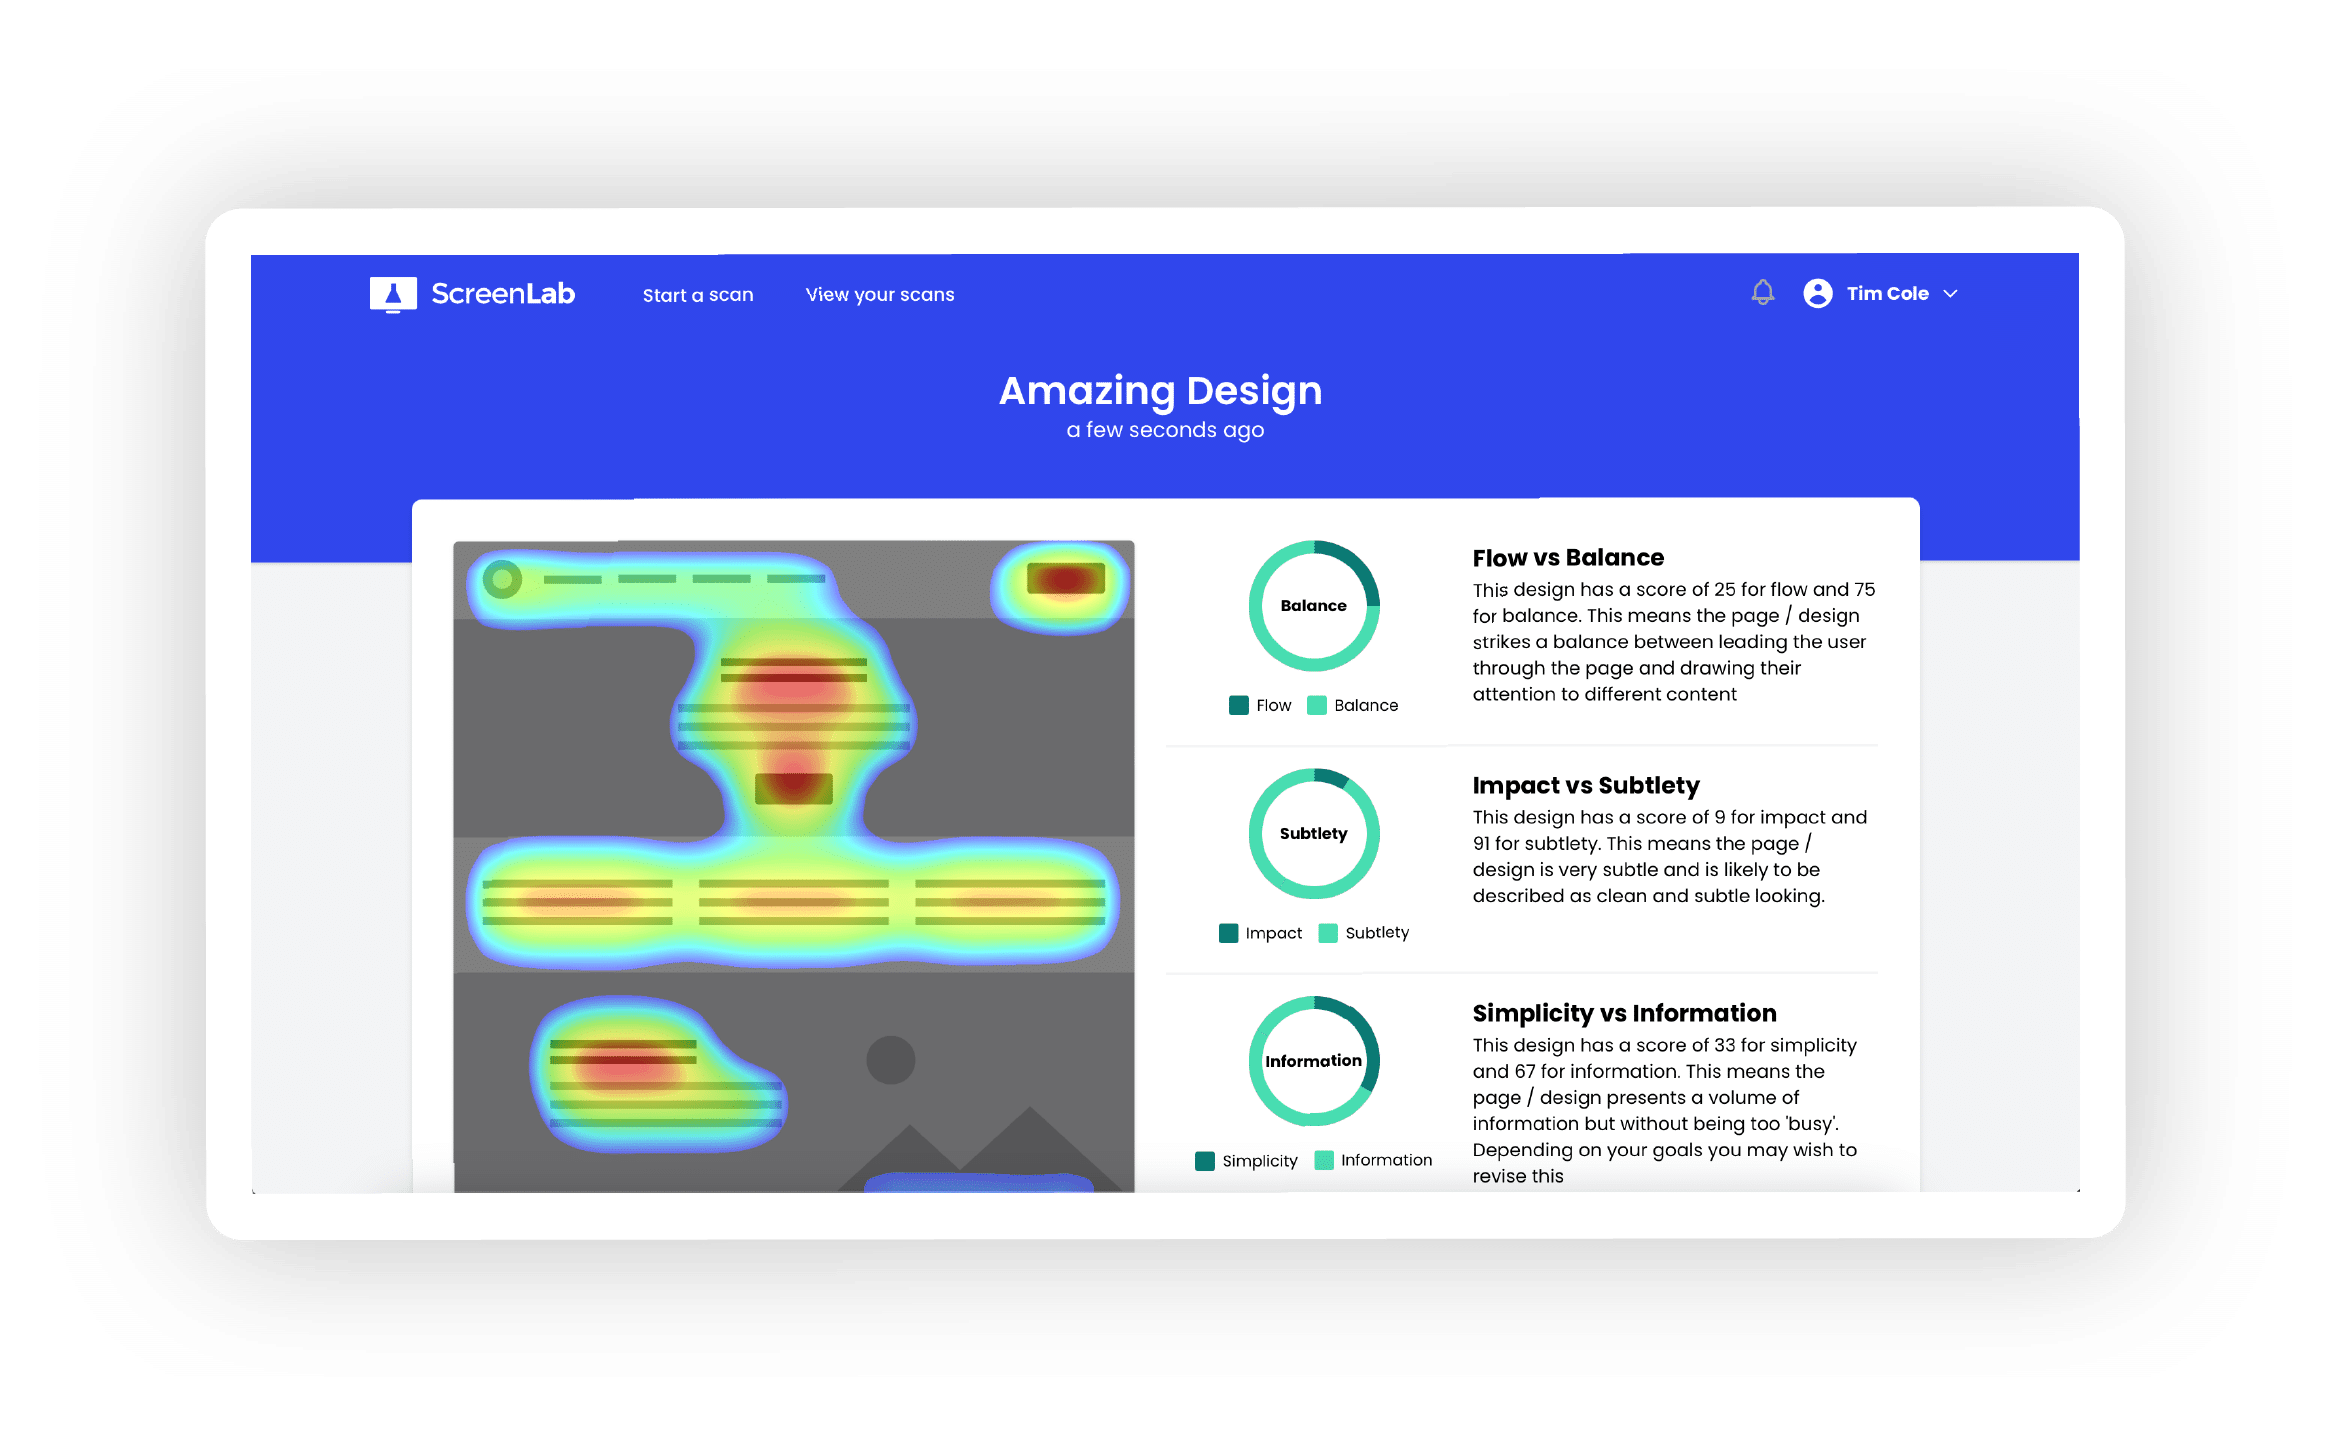
Our proprietary algorithm, built on data from eye tracking studies, psychology, and neuroscience research, empowers you to make informed design choices. Discover the fascinating science that sets ScreenLab apart.
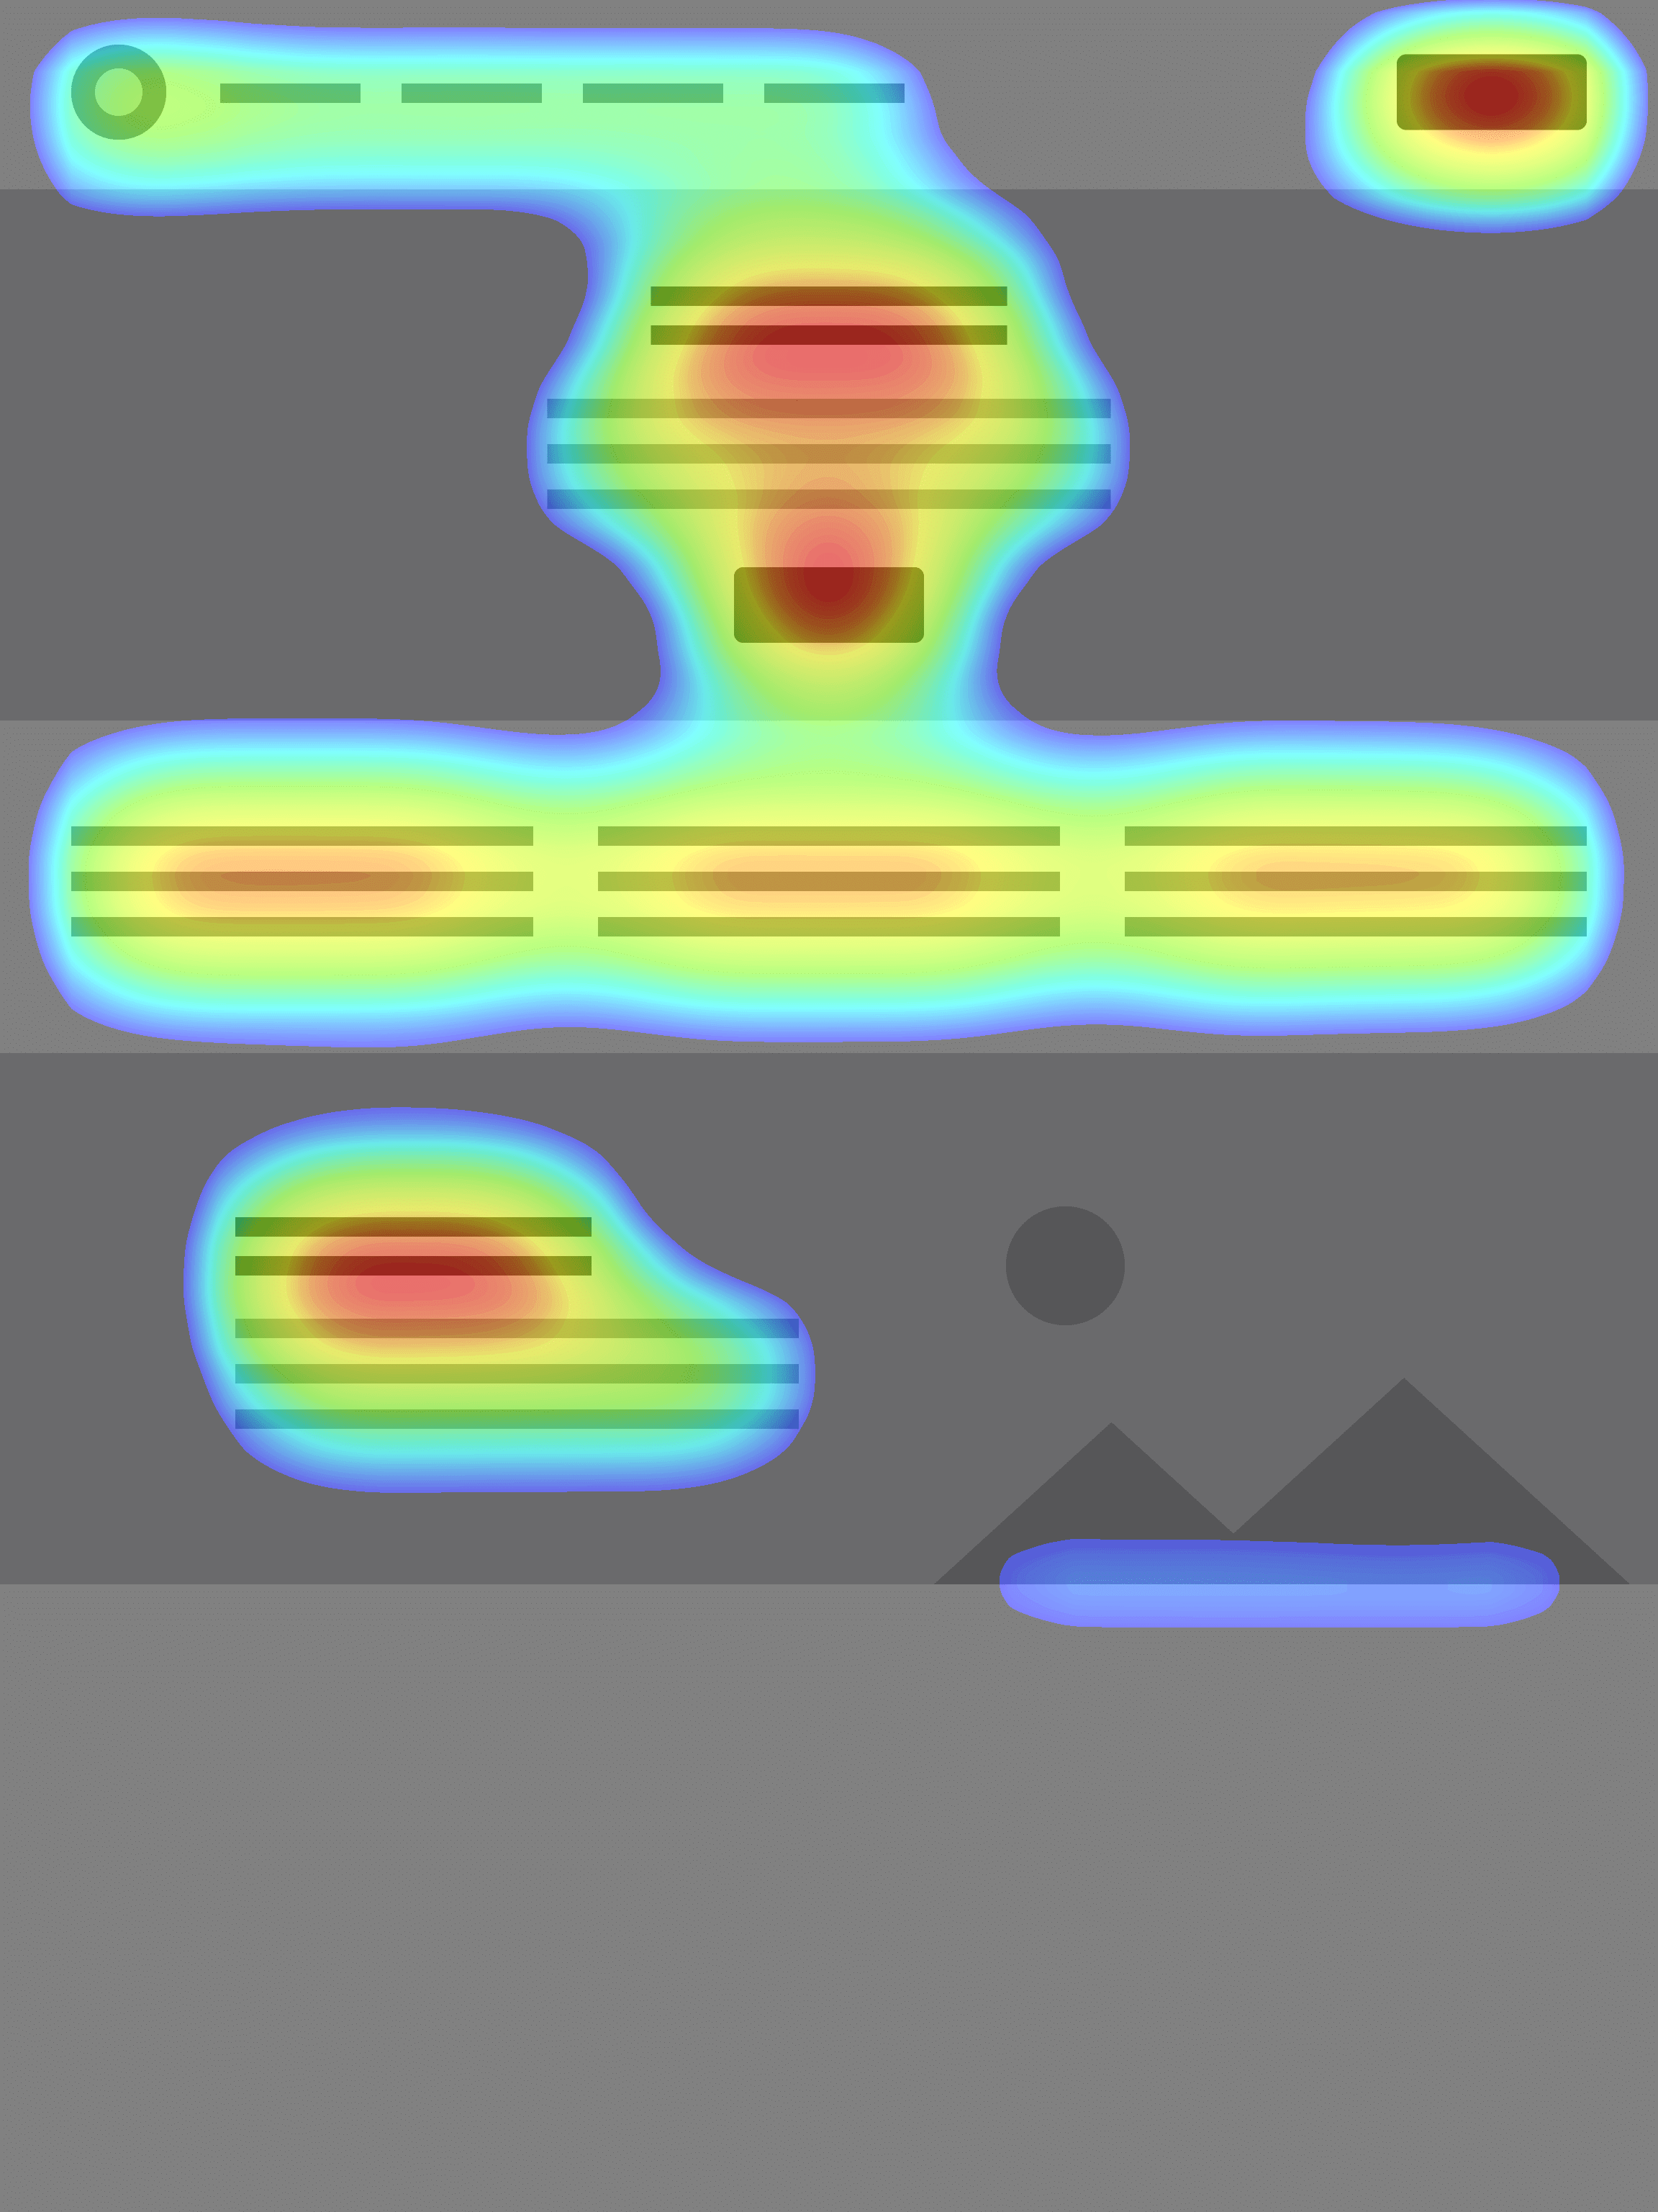

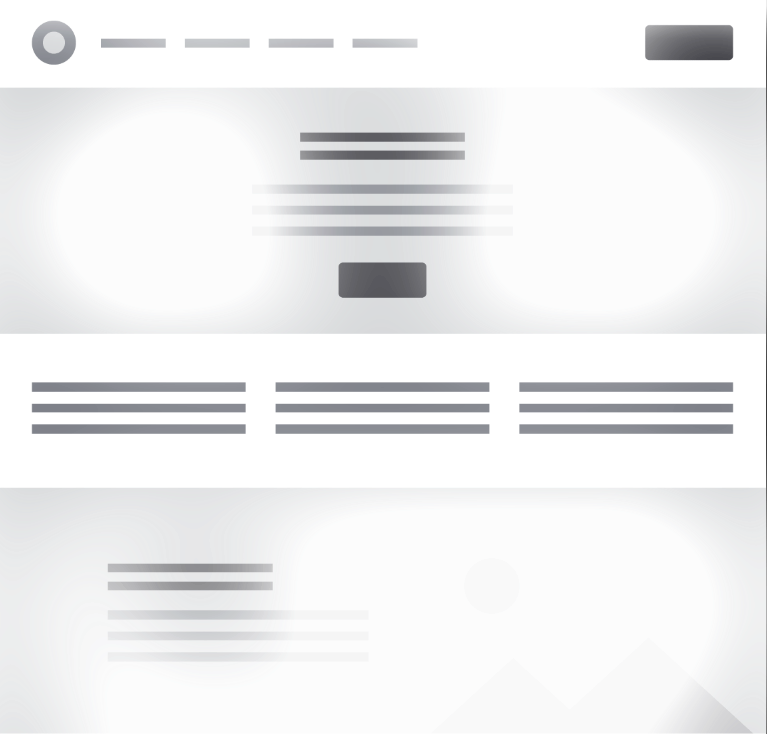
ScreenLab's unique set of metrics opens up a world of possibilities to enhance your UI and delight your users.
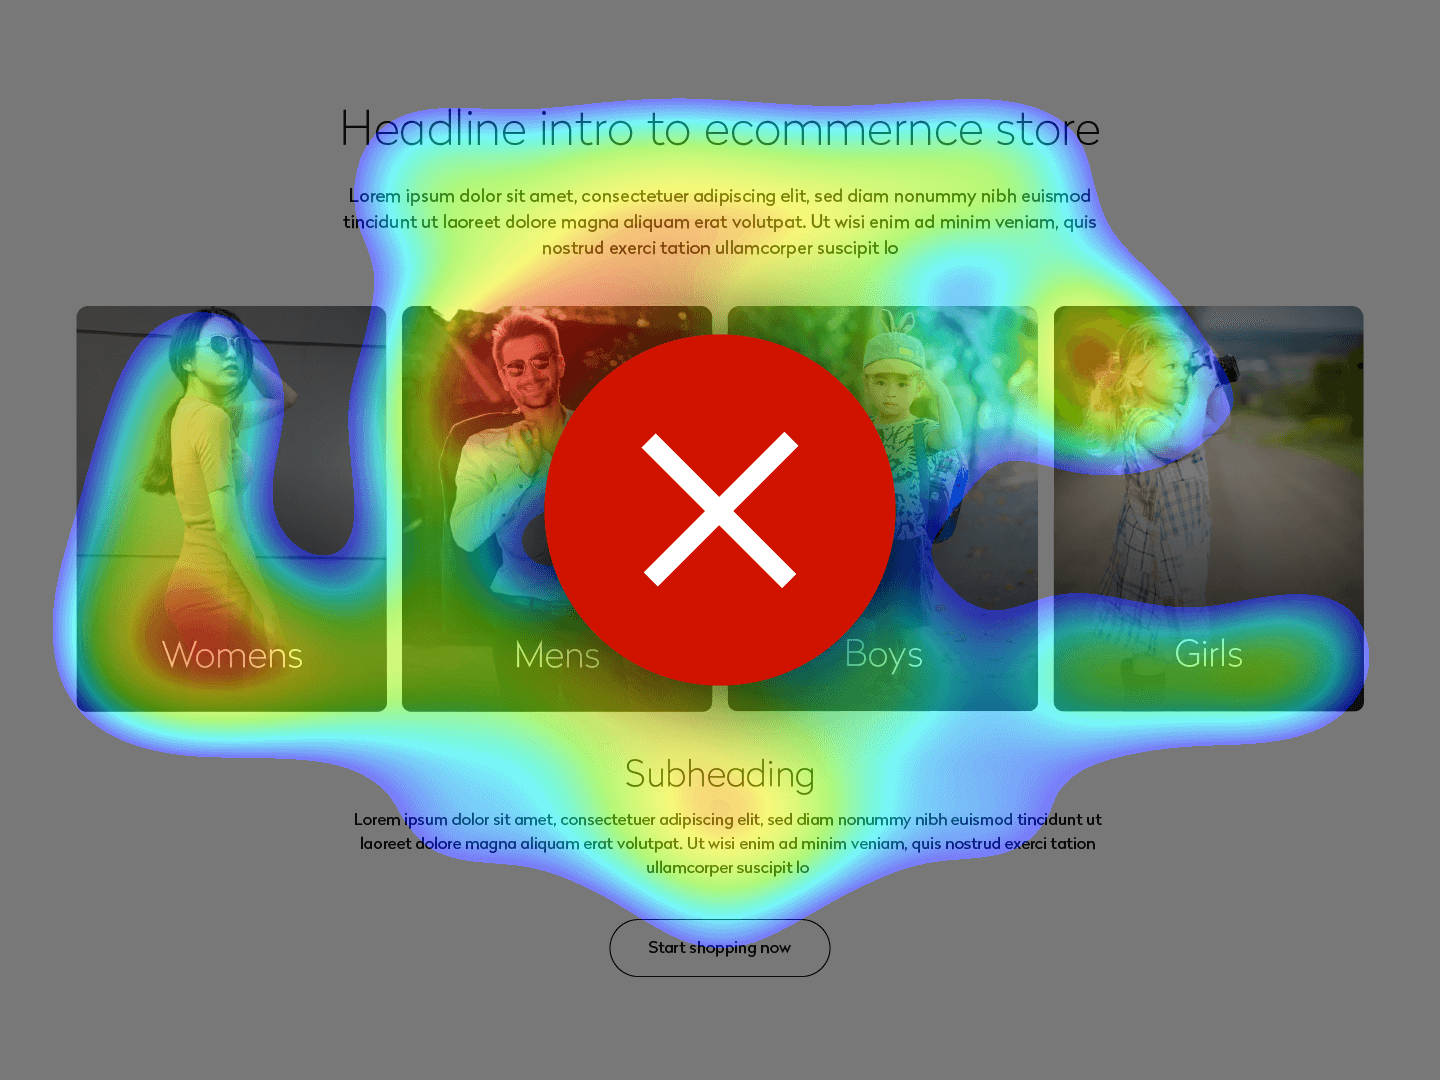
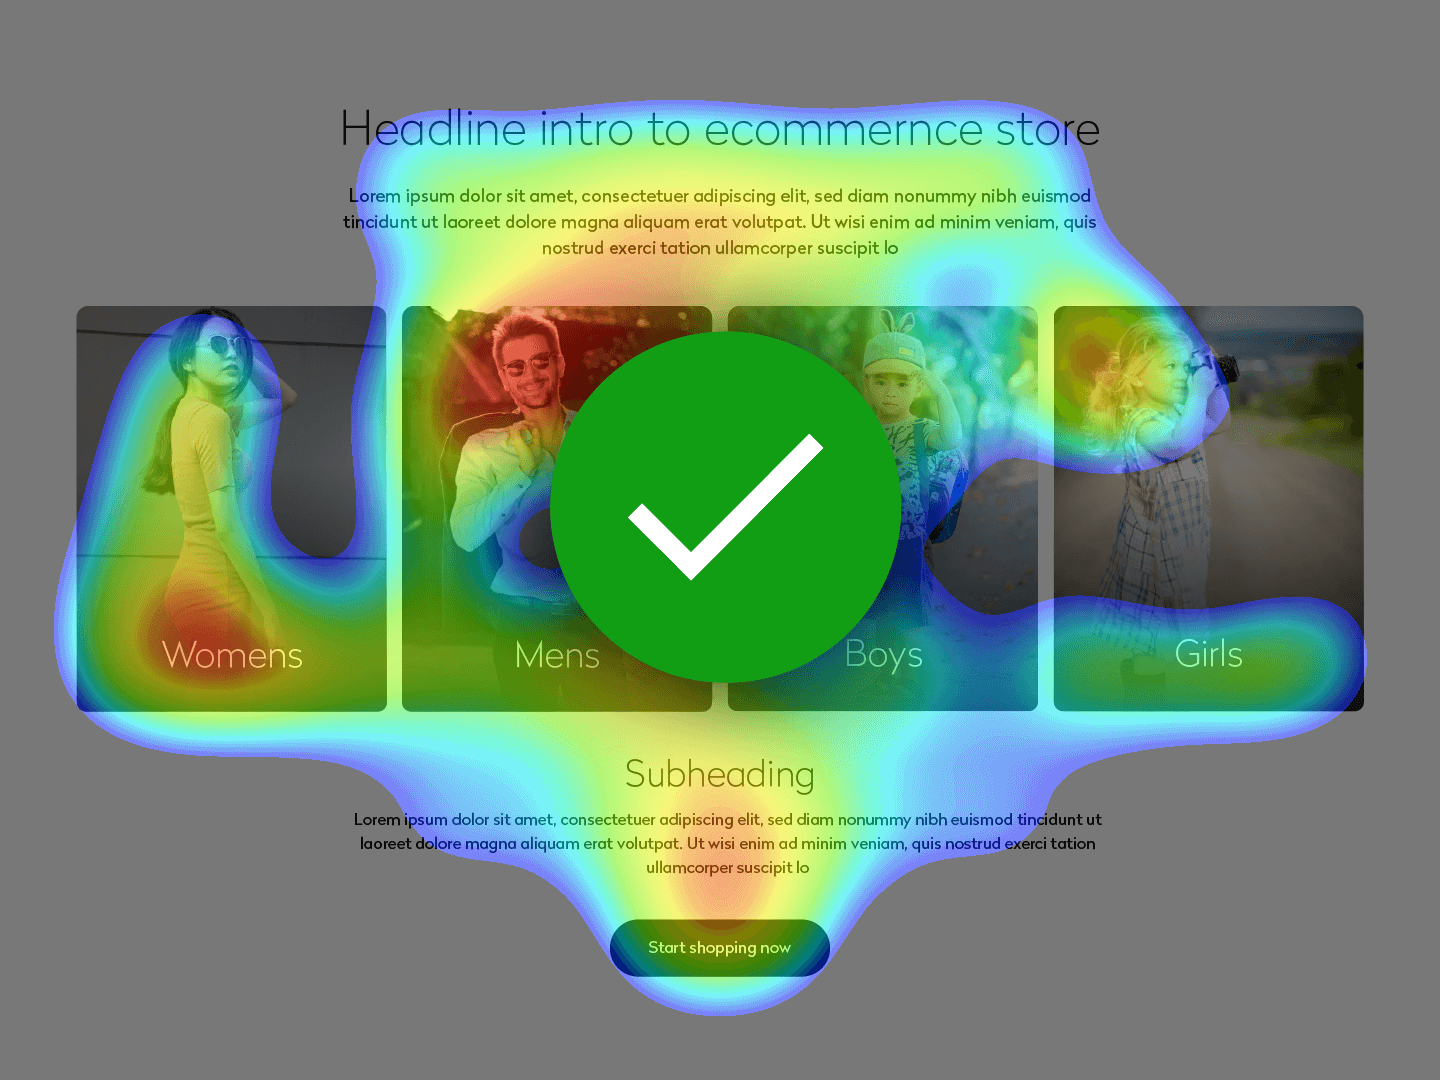
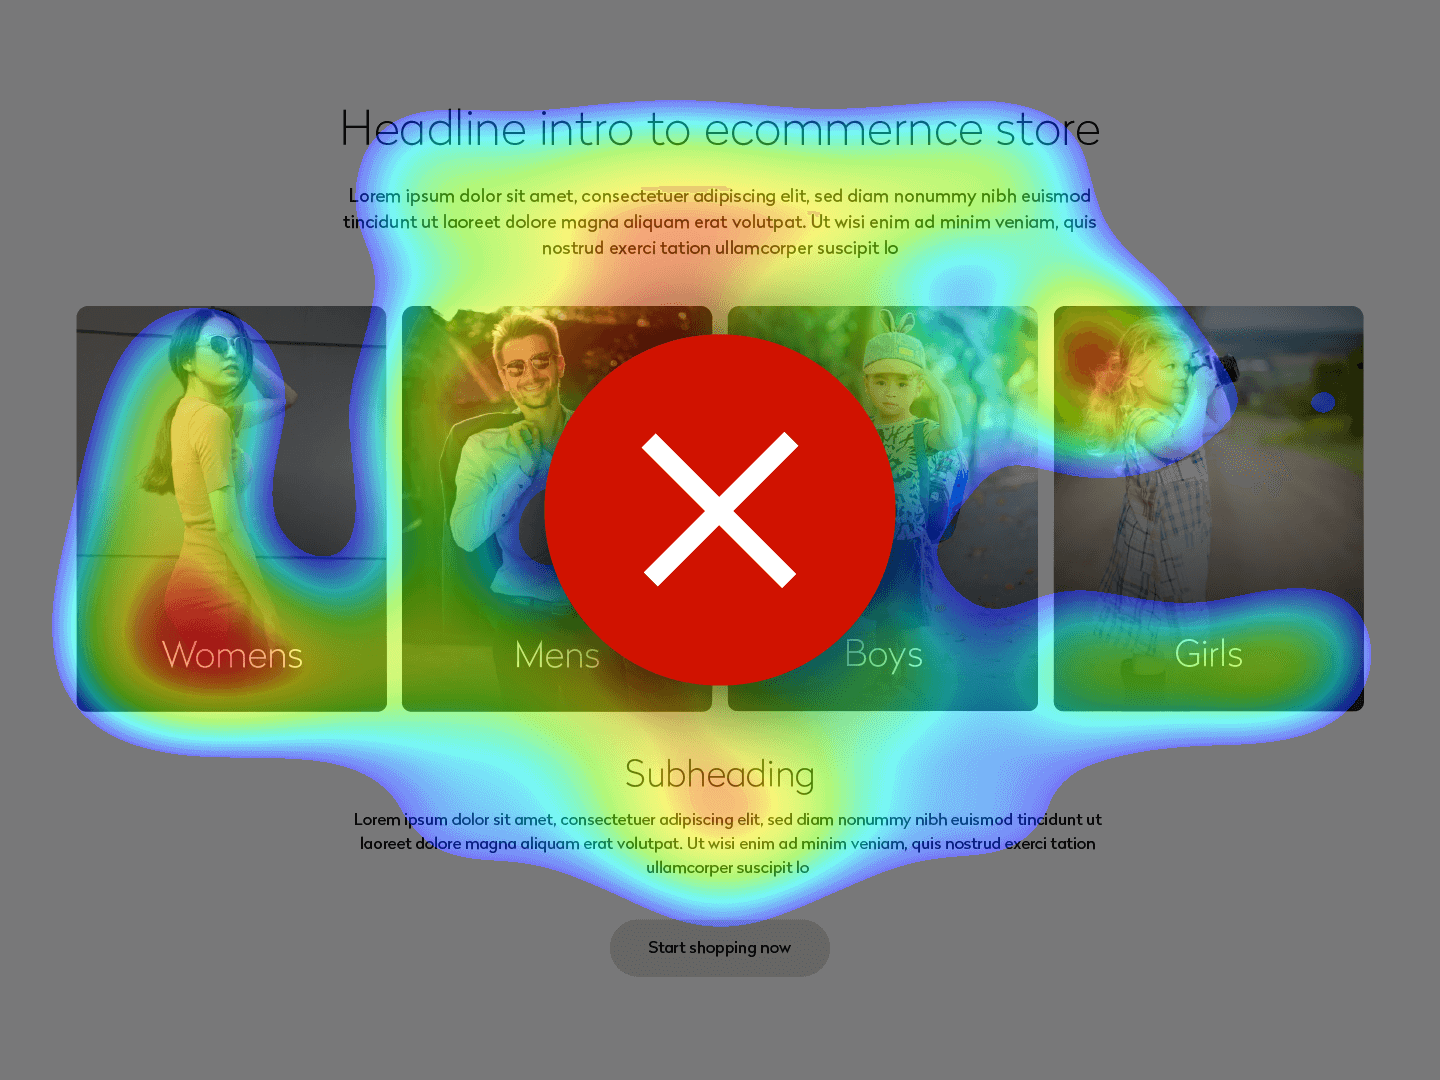
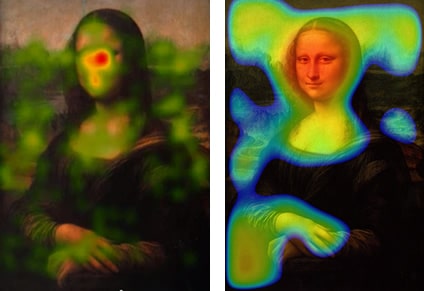
This heatmap indicates areas of a webpage that attract the most user attention, represented by the concentration of colors from green (low attention) to red (high attention).
Key Observations:
Recommendations:
Increase Emphasis on Call-to-Action (CTA) Buttons:
Use ScreenLab to test design mockups and get immediate results. Compare variations using heatmaps and make data based decisions. Avoid getting bogged down in subjective discussions and costly mistakes
We improve our products and advertising by using Microsoft Clarity to see how you use our website. By using our site, you agree that we and Microsoft can collect and use this data. Our Terms and Conditions page has more details.