Anyone who works with eye tracking data knows that the results you get are intricately linked with the task being performed. That’s why when we assembled the ScreenLab team we brought together not just extensive imaging science know-how but also top-flight experience in UI and UX design.
Eyes arent just passive receptors; they group and process the signals received. Our simulation engine takes this into account when modelling how users respond.
There are dozens of pyschological cues in what the eye sees. Color response, pattern recognition and task being performed all change a viewer's observations.
Web developers apply design principles because they understand this changes what users perceive. We've put our web design expertise in ScreenLab so that it does too.
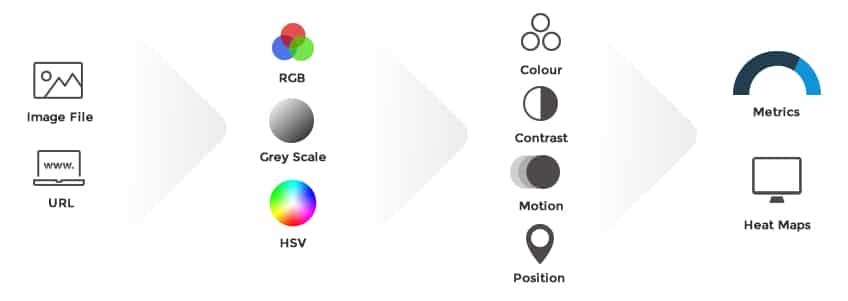
Our model was designed from the ground up taking account of the physiology and psychology of vision as well as the application of design. Based on extensive, published data along with in-house research we refined attention theory for web design and identified key features and visual stimuli.
Our computer vision package, developed using the powerful OpenCV library, was then constructed to extract and grade these features.
Red grabs attention, but the differences in colors are just as important as the colors themselves. ScreenLab accounts for local and global contrast as well as color tone and brightness.
Our eyes and brains have evolved to snap attention to motion. ScreenLab includes evaluation of video and dynamic content so you get a true picture of what your users see.
From just a few weeks old our brains are wired to pick out faces. Even as adults we are still instinctively drawn to them. Our engine knows this too.
Our brains seek out patterns, even when there are none. We're also trained to see patterns like text. Put these together, and patterns become powerful attractors.
Our eyes are hard-wired to respond to contrast and edges. ScreenLab models this as well as the brain's processing and enhancement.
Every designer knows position matters. Users' experiences dictate where they look for features and how they expect different types of content to relate.
Our model considers the same things your user’s brain does: color analysis, dynamic content and motion, spatial frequency, contrast and pattern recognition. We combine this data to give you hot zones and analyse them to provide quantitative image metrics. You can find out more about our model from our white paper.
© Copyright 2014 ScreenLab Ltd. All Rights Reserved.